Get Newsletter
Notification products, updates
 ×
×Notification products, updates


January 7, 2025
The series proved to be a nightmare for top-order batters, with only two managing to finish with averages above 40.
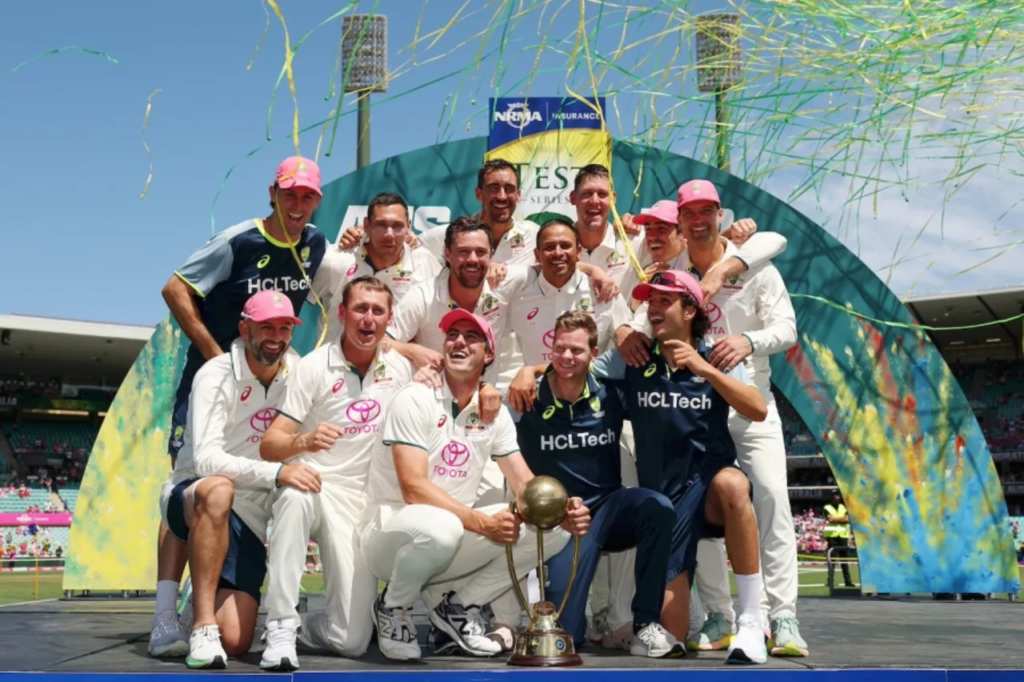
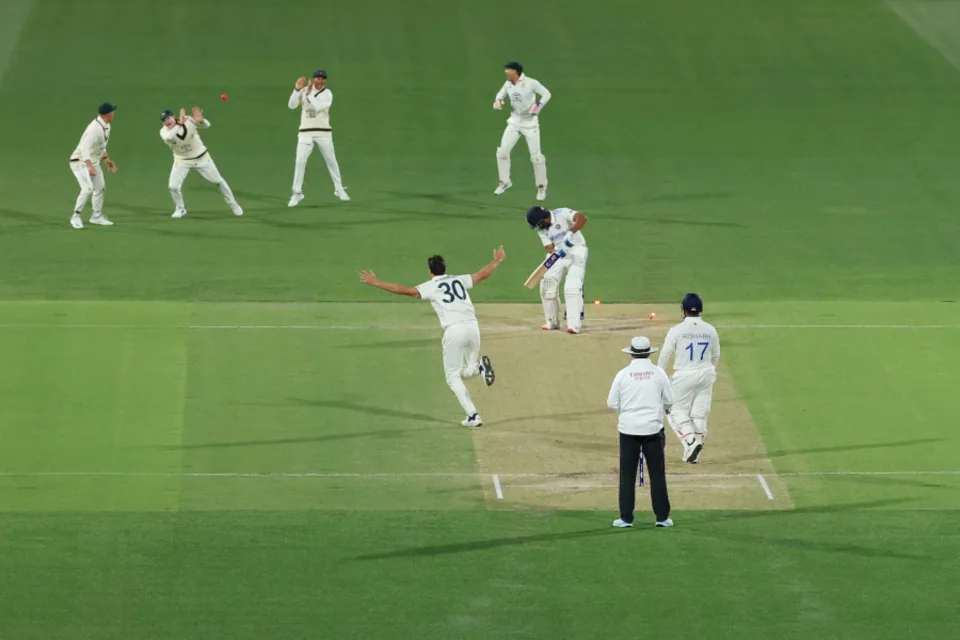
Australia’s pursuit of the 2024-25 Border-Gavaskar Trophy began on a sour note with a crushing defeat in Perth. However, they mounted an impressive turnaround, winning three of the next four Tests to claim the series 3-1. This comeback victory is a rarity in Australia’s storied cricket history. It marked only the eighth occasion they have recovered from an opening Test loss to win a series—and just the second time they have achieved this feat since 1970.
Australia’s ability to stage a comeback after losing the opening match of a Test series has been a rare but remarkable feat. Here’s a list of their series wins achieved after starting with a defeat:
These historic victories highlight Australia’s resilience and ability to bounce back in challenging situations, cementing their reputation as one of the greatest Test-playing nations.
The 2024-25 Border-Gavaskar Trophy marked the 31st time since 1970 that Australia had lost the opening match of a Test series. Of these 31 instances, only this series and the 1997 Ashes series in England resulted in a series victory for Australia. In the other 29 cases, Australia went on to lose 24 series and draw five.
At home, the situation was even more disheartening. Australia has lost the first Test on nine occasions since 1970 and have been defeated in seven of those series, which highlights the uphill challenge faced by the team this time around.
This series was also one of the most challenging for batters in recent memory. With a runs-per-dismissal figure of just 24.32, the 2024-25 Border-Gavaskar Trophy had the lowest batting average among the 38 Test series of three or more matches in Australia since the Australia vs. Pakistan series in 1995. In that series, the batting average was 23.74, making these two series the lowest-averaging in Australia since 1985.
Throughout the Border-Gavaskar series, there were eight totals under 200, six of them from India. This is only the third instance in Australian Test cricket history where there have been so many sub-200 totals. The only two series with more sub-200 scores were the 1978-79 Ashes series (13 totals) and the 1901-02 Ashes series (9 totals).
The statistics are a testament to the tough conditions, disciplined bowling, and the overall difficulties that both teams faced with the bat in this series.
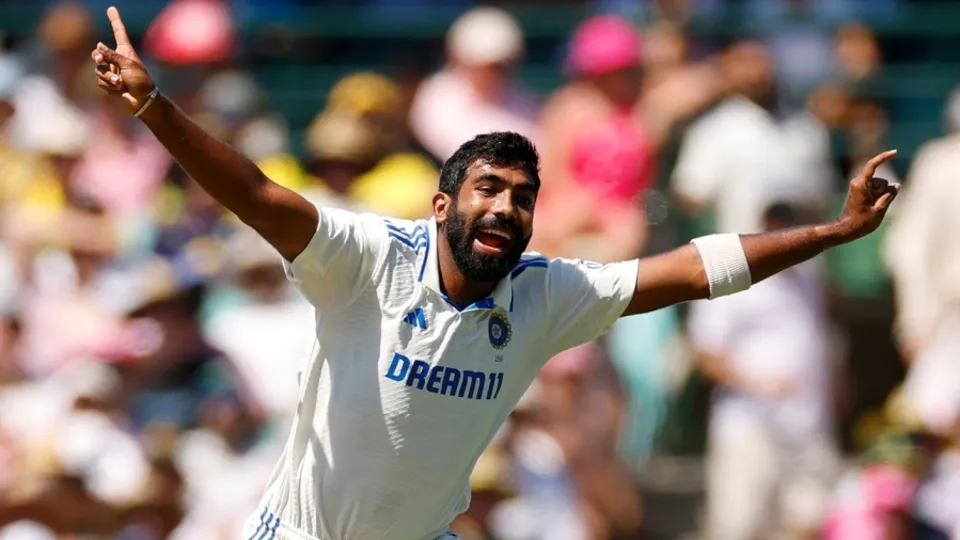
Jasprit Bumrah delivered an exceptional performance throughout the series, claiming 32 wickets across five Tests at an impressive average of 13.06 and a remarkable strike rate of 28.3. His tally of wickets is the joint-highest for an Indian fast bowler in a Test series and the most ever for an Indian bowler in an away series.
Indian Bowlers in the Border-Gavaskar Trophy 2024-25
| Bowler | Balls | Wickets | Average | Strike Rate | Economy Rate |
|---|---|---|---|---|---|
| Jasprit Bumrah | 908 | 32 | 13.06 | 28.3 | 2.76 |
| Other Bowlers | 2814 | 48 | 37.08 | 58.6 | 3.79 |
| Other Pacers | 2106 | 40 | 34.82 | 52.6 | 3.96 |
Excluding Bumrah, the other India seamers took 40 wickets at an average of 34.82, with a strike rate of one wicket every 52.65 balls. When including the spinners, India’s overall non-Bumrah bowling average in this series was 37.08, with a strike rate of 58.6. Bumrah’s absence in the fourth innings at Sydney effectively ruled out any chance of India defending a target of 162.
Bumrah’s performance was exceptional, as the gap between his average and that of the other Indian bowlers stands as the fifth-highest ratio among fast bowlers with 25 or more wickets in a Test series. The highest ratio of 3.78 was set by Richard Hadlee, who averaged 12.15 in the 1985 Trans-Tasman Trophy across three matches, while the other New Zealand bowlers averaged 45.95.
Ahead of the Rest
Highest Ratio Between a Pacer’s Average and the Average of His Teammates in a Test Series
| Bowler | Series | Matches | Player Wkts | Player Avg | The Rest Wkts | The Rest Avg | Ratio |
|---|---|---|---|---|---|---|---|
| Richard Hadlee | NZ in AUS, 1985-86 | 3 | 33 | 12.15 | 22 | 45.95 | 3.78 |
| Bruce Taylor | NZ in WI, 1972-73 | 5 | 27 | 17.7 | 35 | 64.8 | 3.66 |
| Imran Khan | IND in PAK, 1982-83 | 6 | 40 | 13.95 | 41 | 47.71 | 3.42 |
| George Lohmann | ENG in SA, 1895-96 | 3 | 35 | 5.8 | 24 | 17.17 | 2.96 |
| Jasprit Bumrah | IND in AUS, 2024-25 | 5 | 32 | 13.06 | 48 | 37.08 | 2.84 |
Throughout the series, Bumrah bowled 151.2 overs, accounting for 24.4% of all balls bowled by India’s bowlers, and his 32 wickets made up 40% of the team’s total. His contribution in both overs bowled and wickets taken is unparalleled in the series, with Scott Boland being the only bowler with similar figures. Despite featuring in only three Tests, Boland bowled 15.47% of Australia’s total deliveries and took 21 wickets, representing 24.71% of their total wicket haul.
Here is a summary of the key data presented in the table:
This highlights the significant role of key fast bowlers such as Bumrah and Cummins, who carried the load for their respective teams in the series.
In a series marked by struggles at the top of the order, the lower-order batsmen rose to the occasion. The top-order pairs were largely ineffective, with only 14 out of 92 partnerships for the first five wickets surpassing 50 runs. Even more concerning, only three partnerships reached the 100-run mark. Out of 85 Test series featuring 90 or more partnerships across the first five wickets, this series stands out for having only three century partnerships—one of the few with such a low number.
This highlights the resilience and contributions from the lower-order players, whose performance became increasingly vital in a series dominated by challenges at the top.
| Partnership Range | Runs | Highest Score (HS) | Average | Balls per Wicket | 100s | 50s |
|---|---|---|---|---|---|---|
| 1-5 wickets | 2476 | 241 | 27.82 | 50.25 | 3 | 11 |
| 6-10 wickets | 1933 | 127 | 24.78 | 40.91 | 2 | 10 |
The series saw a significant contribution from the lower-order partnerships, although the top-order struggled. The first five-wicket partnerships accumulated 2476 runs, with an average of 27.82, while the 6-10 wicket partnerships added 1933 runs at an average of 24.78, highlighting a solid contribution from the tailenders.
The 14 fifty-plus partnerships for the first five wickets during the Border-Gavaskar Trophy 2024-25 rank as the joint second-fewest in Test series history. This is only surpassed by the 12 such partnerships in the 1976-77 India-England series, and it is tied with the 14 partnerships in the 1905-06 South Africa-England series.
Here are the Test series with the highest percentage of runs coming from partnerships between the 6th and 10th wickets:
| Series | Season | Total Runs | Runs by 6-10 Wickets | Percentage (%) |
|---|---|---|---|---|
| IND in WI | 1961/62 | 4957 | 2402 | 48.46 |
| WI in IND | 1983/84 | 5521 | 2667 | 48.31 |
| AUS in ENG | 1902 | 3041 | 1409 | 46.33 |
| WI in AUS | 1984/85 | 4767 | 2172 | 45.56 |
| ENG in SA | 1905/06 | 3959 | 1770 | 44.71 |
| IND in ENG | 2014 | 5213 | 2309 | 44.29 |
| IND in AUS | 2024/25 | 4409 | 1933 | 43.84 |
Test series of five or more matches.
Despite challenges in the top and middle order, the middle and lower orders made crucial contributions throughout the series. A total of 12 partnerships for the last five wickets surpassed 50 runs, including two partnerships that exceeded 100 runs. Over the course of the series, the last five wickets contributed 1933 runs, representing 43.84% of the team’s total runs.
This percentage ranks as the seventh-highest for runs scored by the last five wickets in any five-match Test series. Additionally, the last five wickets faced 3191 balls out of a total of 7664 balls, which amounts to 41.64% of the total balls faced. This is the highest proportion of balls faced by the last five wickets in any five-match Test series for which complete fall-of-wickets data is available.
The partnerships for the 6-10 wickets in the 2024-25 Border-Gavaskar Trophy faced an impressive 41.64% of the total balls in the series, a statistic that highlights the resilience of the lower-order batsmen. This percentage marks the highest for any five-match Test series where comprehensive fall-of-wickets data is available.
Here are the top five Test series where the partnerships for the last five wickets faced the highest proportion of balls:
| Series | Season | Balls | Balls by 6-10 wkts | % |
|---|---|---|---|---|
| IND in AUS | 2024/25 | 7664 | 3191 | 41.64 |
| AUS in ENG | 1948 | 2870 | 1171 | 40.80 |
| ENG in IND | 2023/24 | 9175 | 3741 | 40.77 |
| IND in ENG | 2018 | 9257 | 3484 | 37.64 |
| WI in AUS | 2000/01 | 9034 | 3380 | 37.41 |
The Match-ups That Made the Difference
“I was getting Bumrah-ed.” Usman Khawaja aptly described his struggles during the series, where he scored only 184 runs across five Tests at an average of 20.44. Bumrah dismissed Khawaja six times in eight innings, the most by any bowler to a single batter in this series.
Khawaja’s tally against Bumrah was a mere 33 runs, with an average of just 5.50. In contrast, he fared significantly better against the other Indian bowlers, accumulating 151 runs at an average of 50.33. Khawaja wasn’t the only Australian opener to face difficulties against Bumrah, highlighting the Indian pacer’s pivotal role in the series.
Most Dismissals for a Batter vs a Bowler in the BGT 2024-25
| Batter | Bowler | Inns | Runs | Balls | Wkt | Ave |
|---|---|---|---|---|---|---|
| Usman Khawaja | Jasprit Bumrah | 8 | 33 | 112 | 6 | 5.50 |
| Rohit Sharma | Pat Cummins | 4 | 11 | 44 | 4 | 2.75 |
| Nathan McSweeney | Jasprit Bumrah | 6 | 15 | 66 | 4 | 3.75 |
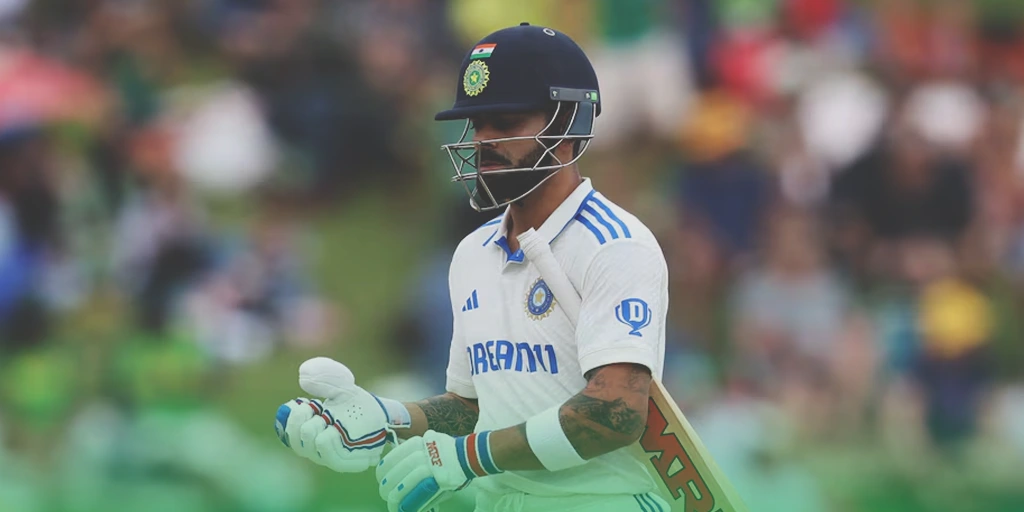
| Virat Kohli | Scott Boland | 5 | 28 | 68 | 4 | 7.00 |
| Rishabh Pant | Pat Cummins | 9 | 51 | 108 | 4 | 12.75 |
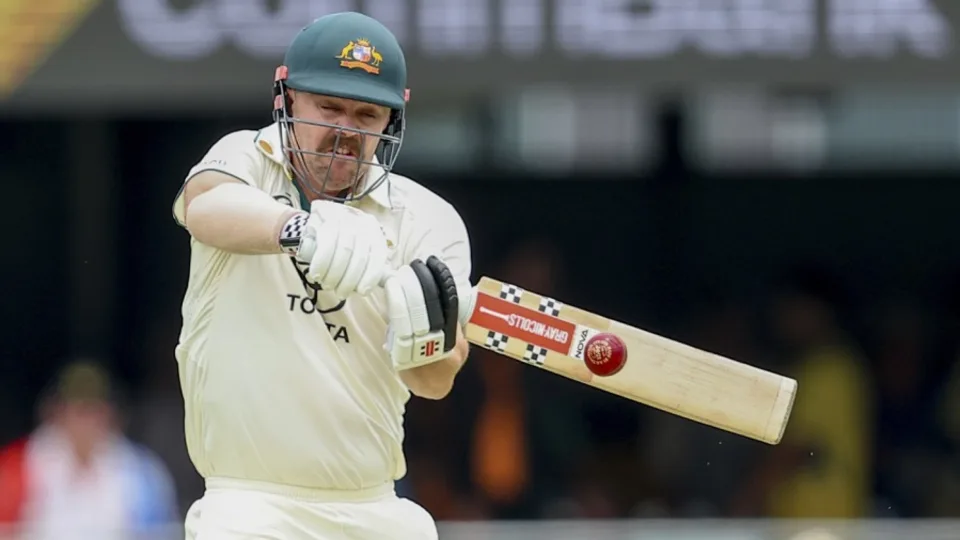
| Travis Head | Jasprit Bumrah | 7 | 83 | 94 | 4 | 20.75 |
| KL Rahul | Mitchell Starc | 9 | 94 | 143 | 4 | 23.50 |
Jasprit Bumrah also had a significant impact on Nathan McSweeney’s debut series, dismissing him four times for just 15 runs. McSweeney, however, showed resilience against the other bowlers, scoring 57 runs off 146 balls with just a single dismissal. Similarly, Travis Head, another key Australian batter, also struggled against Bumrah, falling to the fast bowler on four occasions.
Pat Cummins made a strong impact on Rishabh Pant, dismissing him four times for 51 runs, despite having never dismissed him in Tests prior to this series. Scott Boland was similarly effective against Virat Kohli, removing him four times in five innings, with a remarkable average of just seven.
For Rohit Sharma, it was Pat Cummins who proved to be his nemesis, claiming his wicket four times in four innings for just 11 runs. Meanwhile, Yashasvi Jaiswal had a standout performance against Nathan Lyon, scoring 63 runs from the 122 balls he faced without being dismissed.
| Batter | Bowler | Inns | Runs | Balls | 4s | 6s | Bat SR |
|---|---|---|---|---|---|---|---|
| YBK Jaiswal | NM Lyon | 3 | 63 | 122 | 5 | 1 | 51.63 |
| SPD Smith | NK Reddy | 3 | 53 | 63 | 7 | 0 | 84.12 |
| SPD Smith | RA Jadeja | 3 | 52 | 71 | 8 | 0 | 73.23 |
| PJ Cummins | Akash Deep | 4 | 44 | 39 | 6 | 1 | 112.82 |
| TM Head | RA Jadeja | 1 | 44 | 55 | 5 | 0 | 80.00 |
| V Kohli | NM Lyon | 4 | 44 | 78 | 2 | 1 | 56.41 |
These are the most runs any batter scored off a bowler in the 2024-25 Border-Gavaskar Trophy without being dismissed, with the only head-to-head encounter spanning over 100 balls without a dismissal being Yashasvi Jaiswal’s 63 runs off Nathan Lyon. Steven Smith managed 53 runs without being dismissed against Nitish Kumar Reddy and 52 against Ravindra Jadeja.
Travis Head, Yashasvi Jaiswal, and Steven Smith were the only players to accumulate over 300 runs in the series, with Head leading the pack on 448, followed by Jaiswal with 391 and Smith at 314. Among the 18 players who batted in six or more innings, only Head averaged over 50 with a stellar 56. Jaiswal, with an average of 43.44, was the only other player to surpass a 40 average.
In the 2024-25 Border-Gavaskar Trophy, left-handed batters (LHB) enjoyed a clear advantage over their right-handed counterparts (RHB). LHBs scored 1,876 runs across 70 innings, averaging 30.75 with a strike rate of 54.53, including 3 centuries and 8 fifties. In comparison, RHBs accumulated 2,204 runs in 122 innings, but averaged just 20.79 with a strike rate of 51.17, hitting 4 centuries and 7 fifties.
With Travis Head and Yashasvi Jaiswal leading the run charts, left-handed batters outperformed their right-handed counterparts in the 2024-25 Border-Gavaskar Trophy, averaging 30.75 compared to 20.79 for right-handers. The right-handers’ average of 20.79 is the eighth-lowest among 175 Test series of five or more matches. Notably, only one of the top seven lowest averages has occurred since 1980—the 2000 Wisden Trophy, where right-handers averaged a mere 19.32.
This series marked Australia’s long-awaited triumph over India, ending a decade-long drought. Their last Test series win against India was in the 2014-15 season. Since then, Australia played four Test series against India—two at home and two away—each concluding with a 2-1 result in favor of India. With this victory, Australia became the first team to hold the series trophy against all nine Test nations simultaneously. Additionally, they are now the holders of the ICC World Test Championship title, alongside their series wins against every Test-playing nation.
Teams that have held the Test series trophy against every Test nation (excluding Afghanistan and Ireland)
| Team | Start Date | End Date | Duration (Days) |
|---|---|---|---|
| Australia | 29 Oct 2004 | 12 Sep 2005 | 318 |
| Australia | 18 Dec 2006 | 10 Nov 2008 | 693 |
| South Africa | 20 Aug 2012 | 5 Mar 2014 | 562 |
| India | 28 Mar 2017 | 17 Jan 2018 | 295 |
| India | 6 Dec 2021 | 14 Jan 2022 | 39 |
| Australia | 5 Jan 2025 | – | – |
Australia first achieved the feat of holding a Test series trophy against all nine Test nations in 2004 when they defeated India. However, their run ended in 2005 with a loss in the Ashes. They reclaimed the status in late 2006, completing a 5-0 whitewash against England at home. South Africa followed as the second team to hold series trophies against all nine opponents, after their series win in England in 2012. They maintained this achievement until Australia defeated them in the 2013-14 season.
India reached the same milestone in 2017 after their home-series victory over Australia, but their run was cut short in early 2018 when they lost to South Africa. India regained the full set of series trophies in 2021 after defeating New Zealand at home. Unfortunately, their tenure was brief as they lost their next series in South Africa.
You may also like: Shan Masood’s Historic Ton Powers Pakistan to Break 136-Year Follow-On Record Against South Africa

Katarzyna Nowak is a seasoned writer with over five years of experience in editorial content, news reporting, and cricket sportsbook app reviews. As an author for 24kbet, she combines her deep understanding of the sports betting industry with a passion for cricket, delivering insightful and accurate content that keeps readers informed and engaged.
Stay Tuned With Updates